Adding Chart Groups
Follow the steps below to add a chart group.
- Access the SmartInsight Designer.
- Open an existing report or create a new report.
- Drag and drop the Chart Group object from the Design tab located on the right side of the window, to the Chart section of the Design canvas.
Result: The Chart Group object now displays in the Chart section in the Design canvas. - Click the Group(x) object just placed in the Chart section of the canvas.
Result: The Properties dialog for the Chart Group object is displayed in the Design panel located on the right side of the window
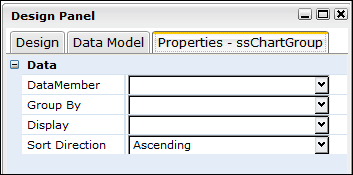
- Click the drop down arrow in the DataMember field and select the data value to be charted.
Result: The DataMember field displays the selected value. - Click the drop down arrow in the Group By field, and select the applicable option.
- Set any other applicable properties.
- Save the report by selecting Report > Save from the main menu.
See Also