Adding Group Objects
The Group section of the design canvas is typically used for one or more group objects (Group By). Each group can be used to represent hierarchical data. Multiple Columns can be added within each group, as well as a themes.
The Group object typically holds the group name field, and can be used to display charts, summary values, or cross-tabs that include data displayed in charts. The group name is printed once at the beginning or end of a group.
Group Sections are useful, and necessary if you want your report data to be clear and easily understood. SmartInsight automatically creates a group header. The group header can be changed to suit your needs.
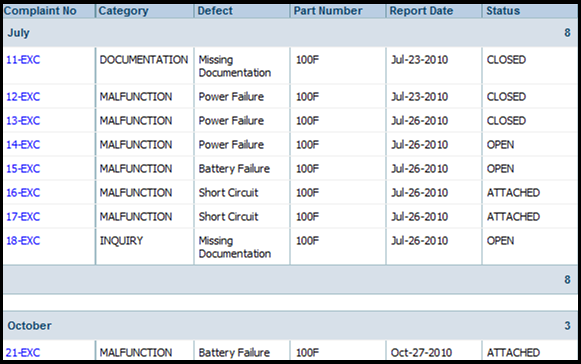
Example of Report Grouping by Month

Follow the steps below to add group objects to a report.
- Access the SmartInsight Designer.
- Open an existing report or create a new report.
- Drag and drop the Group object from the Design tab located on the right side of the window, to the desired location in the Group(s) section of the Design canvas.
Result: The Group object now displays in the Group(s) section in the Design canvas. - Click the Group object just placed in the Group(s) section of the canvas.
Result: The Properties dialog for the Group object is displayed in the Design panel located on the right side of the window

- Click the drop down arrow in the DataMember field and select the data member to be used to set up the Group By option.
Result: The DataMember field displays the selected data member. - Click the drop down arrow in the Group By field, and select applicable option.
- Click the drop down arrow in the Group Display field, and select applicable option (Data to be displayed in the Group header).
- Set any other applicable properties.
- Save the report by selecting Report > Save from the main menu.
See Also